Intro

I am Amarachi Paschaline Ali, a data Analyst skilled in Excel, Power BI and SQL, with a background in Food Science and Technology.
I specialize in analyzing data, building interative dashboards and delivering insights that help organizations make data-driven decisions.
Sales performance dashboard
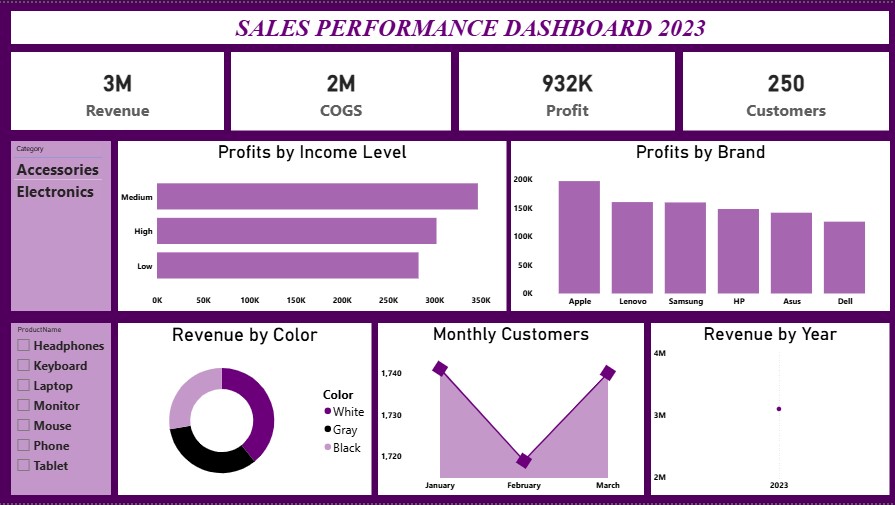
The dashboard provides a clear overview of key performance indicators, including Revenue, Cost of Goods Sold (COGS), Profit, and Customer Count, enabling stakeholders to quickly assess overall business performance.
The analysis highlights important trends across customer segments, product categories, and brands. Findings show that medium-income customers contributed the highest profit, while Apple emerged as the top-performing brand. The dashboard also revealed customer preferences in product colors and provided visibility into monthly customer activity, helping identify opportunities for targeted marketing and sales strategies.
By combining data modeling, analytical thinking, and effective visualization techniques in Power BI, this project demonstrates how business data can be leveraged to support informed decision-making and drive organizational growth. Overall, the dashboard serves as a valuable tool for monitoring performance, uncovering trends, and translating data into actionable insights that can improve profitability and customer engagement.
Excel project
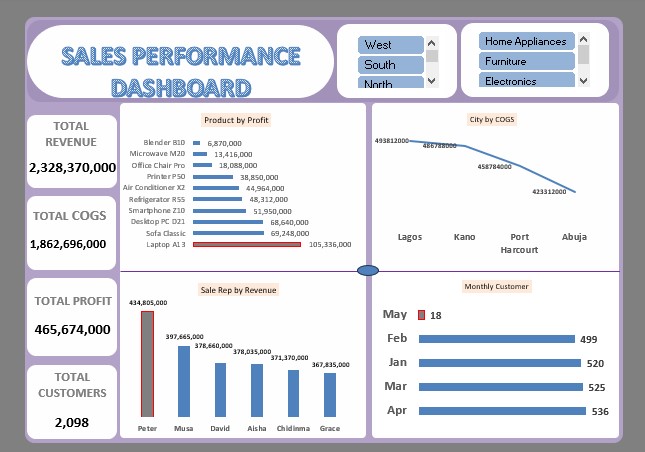 This sales analysis dashboard offers an in-depth perspective on business performance regarding products, sales representatives, locations, and time frames. It emphasizes critical revenue drivers, identifies top products and employees, and showcases trends in customer activity.
These insights facilitate data-driven decision-making, improve sales strategies, and enable management to concentrate resources on the most lucrative opportunities. The analysis indicates that the business is thriving, primarily due to high-value electronics like Laptop A13, Desktop PC D21, and Smartphone Z10. Sales are spearheaded by Peter, with Lagos recognized as the largest market by cost volume. Customer engagement peaked in April, identified as the dashboard's strongest month. This project demonstrates the ability to translate business needs into actionable analytical insights by analyzing sales transactions and creating an interactive dashboard. It reveals essential trends in revenue, profitability, customer engagement, and sales performance, functioning as an effective decision-support tool for stakeholders to monitor performance and recognize growth opportunities.
About

Data Analyst skilled in Excel, Power BI, and SQl, with a B.Sc. in Food Science and Technology. Passionate about transforming data into actionable insights and business value.
Contact
Elements
Text
This is bold and this is strong. This is italic and this is emphasized.
This is superscript text and this is subscript text.
This is underlined and this is code: for (;;) { ... }. Finally, this is a link.
Heading Level 2
Heading Level 3
Heading Level 4
Heading Level 5
Heading Level 6
Blockquote
Fringilla nisl. Donec accumsan interdum nisi, quis tincidunt felis sagittis eget tempus euismod. Vestibulum ante ipsum primis in faucibus vestibulum. Blandit adipiscing eu felis iaculis volutpat ac adipiscing accumsan faucibus. Vestibulum ante ipsum primis in faucibus lorem ipsum dolor sit amet nullam adipiscing eu felis.
Preformatted
i = 0;

while (!deck.isInOrder()) {
    print 'Iteration ' + i;
    deck.shuffle();
    i++;
}

print 'It took ' + i + ' iterations to sort the deck.';
Lists
Unordered
- Dolor pulvinar etiam.
- Sagittis adipiscing.
- Felis enim feugiat.
Alternate
- Dolor pulvinar etiam.
- Sagittis adipiscing.
- Felis enim feugiat.
Ordered
- Dolor pulvinar etiam.
- Etiam vel felis viverra.
- Felis enim feugiat.
- Dolor pulvinar etiam.
- Etiam vel felis lorem.
- Felis enim et feugiat.
Icons
Actions
Table
Default
| Name |
Description |
Price |
| Item One |
Ante turpis integer aliquet porttitor. |
29.99 |
| Item Two |
Vis ac commodo adipiscing arcu aliquet. |
19.99 |
| Item Three |
Morbi faucibus arcu accumsan lorem. |
29.99 |
| Item Four |
Vitae integer tempus condimentum. |
19.99 |
| Item Five |
Ante turpis integer aliquet porttitor. |
29.99 |
|
100.00 |
Alternate
| Name |
Description |
Price |
| Item One |
Ante turpis integer aliquet porttitor. |
29.99 |
| Item Two |
Vis ac commodo adipiscing arcu aliquet. |
19.99 |
| Item Three |
Morbi faucibus arcu accumsan lorem. |
29.99 |
| Item Four |
Vitae integer tempus condimentum. |
19.99 |
| Item Five |
Ante turpis integer aliquet porttitor. |
29.99 |
|
100.00 |